AI4SoilHealth is at the forefront of working with stakeholders to co-design, create and harness digital technology to support pan European Soil Mission efforts. The infrastructure will be used for assessing, and continuously monitoring, soil health metrics. We caught up with David Robinson from the UK Centre for Ecology & Hydrology to find out more about the scientific challenges that AI4SoilHealth is working on to do this and how the project intends to change the way soil health is measured across Europe.
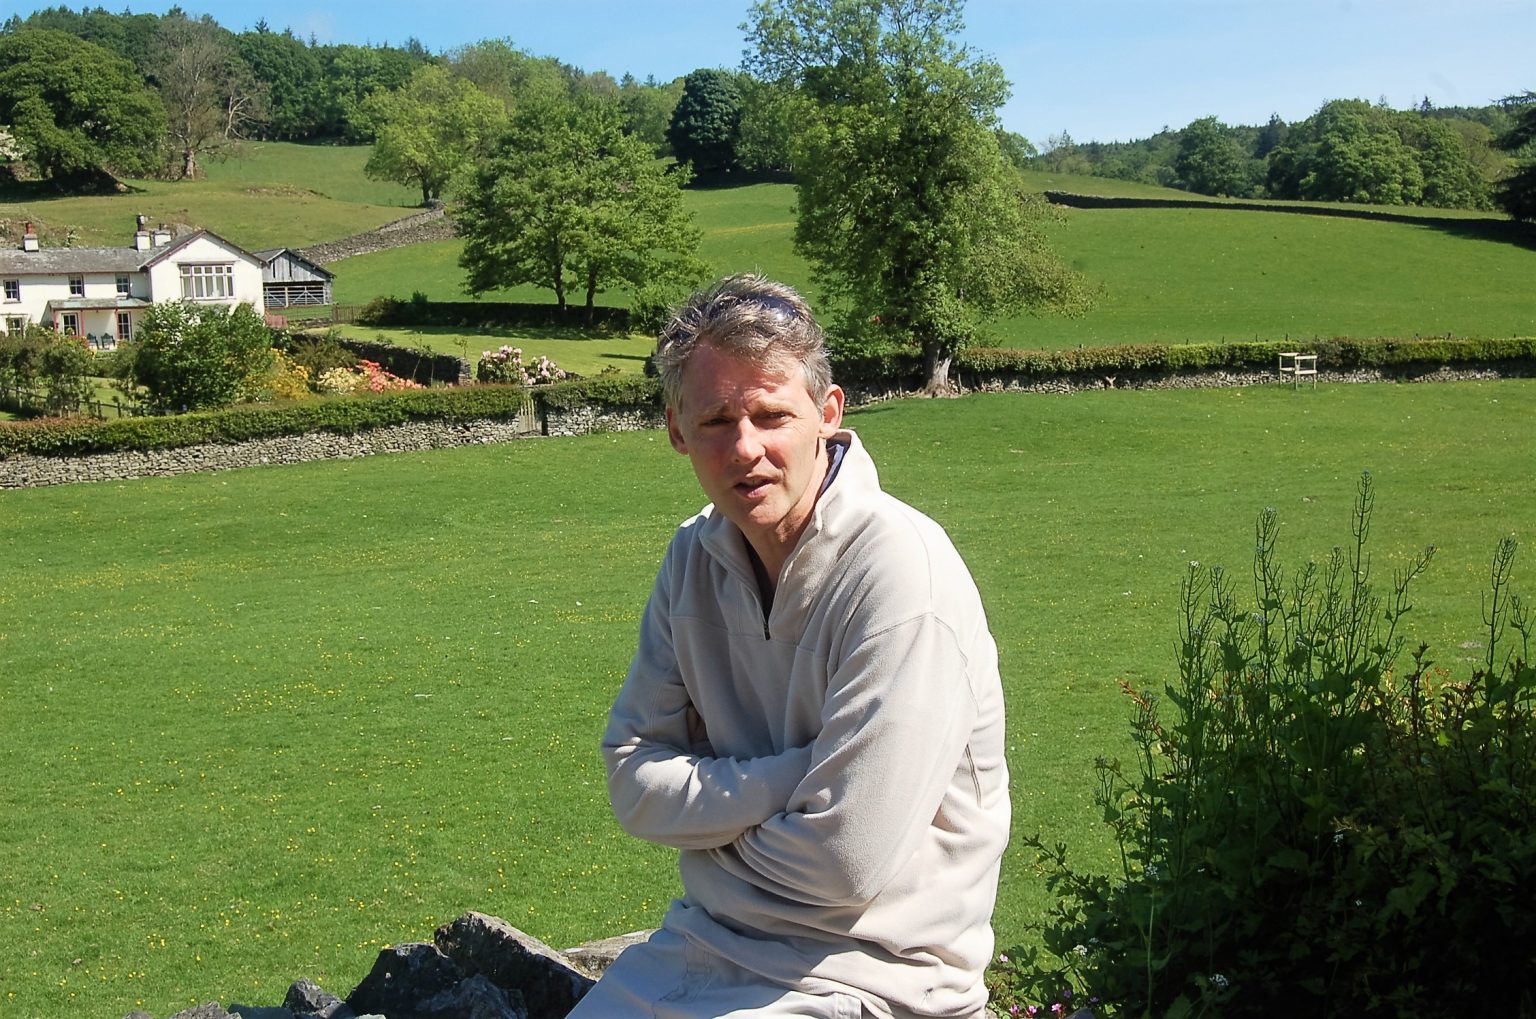
Q: Why is it so important to find a tool which will assess and continuously monitor soil health?
David Robinson
It can be challenging to manage what you don’t measure. If you don’t understand how your soils are changing, then it can be difficult to put management strategies in place to sustain and build soil health. It’s like when you go to the doctor and they measure your pulse to determine how you are doing. In a similar way, AI4SoilHealth is trying to do the same to help people measure the pulse of their soils.
Q: What parameters are the best for being universal, reliable and indicative of soil health?
David Robinson
Soil carbon, pH and probably bulk density are the top three metrics that we look at in our long-term monitoring. These are usually followed by nutrients such as nitrogen and available phosphorus which are helpful for looking at the health of improved land like grasslands and arable systems. Those are the key ones that we measure until we get involved in things like pollutants. You then start to look at metrics like heavy metals, organic pollutants, pesticides but you need to get more specialised.
Q: Is there any work being done on biological indicators as part of this project?
David Robinson
The chemical and physical indicators are quite well established, and trusted, as they’ve been used for decades. Biological indicators are much more challenging for determining change. We can measure the state of biological indicators. This is done by creating a map of microbial diversity from DNA or something like earthworm abundance. But what we really are challenged to be able to do is to measure how the biology is changing. We think that as an interpretive indicator (presence or absence), something like earthworm abundance is really good. From a scientific point of view, it’s currently challenging to put an uncertainty on many biological indicators.
Q: Are there any novel indicators being developed by the project and if so, what are they and how will they be different to the current suite of indicators?
David Robinson
The project is aiming to produce the selection criteria for how to go about selecting an indicator. We’re not necessarily looking at what is the best suite of indicators. We’re looking at how you would select them and that feeds into novel indicators. The novel indicators we’re looking at include genetic methods, for instance, for pollution detection.
We’re also looking at things like tree health. We are seeing if we can use tree health and looking at where we have lost trees, for instance through ash die back, if that makes a difference on soil health in woodlands and can it be scaled up using remote sensing. We’re also looking at heterogeneity in the landscape with high nature value farming and if that has an impact on the health of soils.
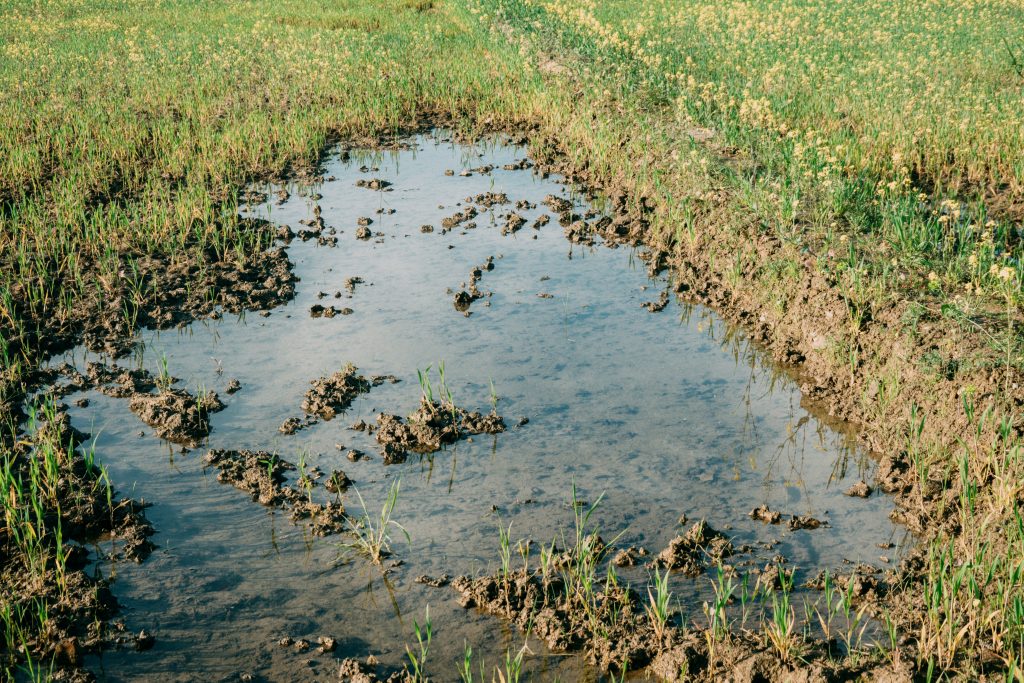
We’ve got some others which are more physical indicators. We’re looking at gas fluxes through the soils, which will link to compaction. And things like time to ponding which is important for runoff and erosion generation.
Q: So there’s a lot of indicators there. Can you explain the soil health index that’s been developed by the project and how that will kind of map those indicators?
David Robinson
The idea of a soil health index is to put indicators together into a suite. Rather than looking at just a single indicator you can aggregate in some way to come up with a score. This will give you an indication of how things are going in general. A common comparison to this might be something like gross domestic product (GDP) where one can look at the different components of an economy, and group it all together into a single number. The point of a soil index is something a little bit similar where you would take a number of these indicators and then look at the composite to be able to say if it’s changing in a positive direction, if it’s changing in a negative direction, or if there’s no change at all. It might be on something simple like a traffic light system and would indicate when you need to take action.
Now in the EU soil monitoring law they have proposed a ‘one out – all out’ policy to indicators. So, if a single indicator is negative then they’d be saying that the soil is unhealthy. I think a lot of soil scientists are kind of pushing back on that because that’s not always the case or it’s very restrictive. There’ll be a lot of discussion about how an index develops. And how it should be interpreted. But we don’t have it yet. We have some ideas about how to go about it. But that’s hopefully something that will emerge from the project.
Q: Can you explain how the project will merge the legacy data that we have from LUCAS and other agencies with the newly collected data that farmers and scientists will be taking from the field?
David Robinson
OpenGeoHub have been putting out a call to all partners as well as anybody else who has data available that is geolocated. This can be incorporated into the analysis. One set of mapping will have just the LUCAS data. Which is internally consistent, and that’s an important point that it’s all been measured in the same way. Then they’ll have a second set of maps where they are starting to incorporate data and information from other countries. For example, in the UK, they have approached Welsh government for data. They’ve approached UKCEH for Countryside Survey data which we have going back to the 1970s. These datasets will be incorporated into their international modelling efforts.
Q: What actions will AI be specifically performing in this project?
David Robinson
Quite a lot of the mapping we are doing is powered using AI methods. We’re trying to understand how to generate the relationship between a set of factors plus a target variable and we’re trying to get at a target variable which might be, a carbon map or a pH map or a soil map of some form that’s based on multiple layers.
Based on all these layers, and based on the data, AI uses an algorithm to predict a target variable like soil carbon where we don’t have data and information.
Q: How will the soil health index account for soil districts across Europe and how will we ensure that the app that’s being created is targeted to the specifics of the land manager who’s using it?
David Robinson
At the moment, we don’t know what a soil district is going to look like. And whether it’s going to be some administrative boundary or whether it will be based on some physical parameters. One of the ways that we’ve been looking at reporting is to create a distribution of data. So, if you’re on a farm in a certain location, we would select a bunch of farm locations in a similar set of soil types. Then we would give the statistics or the distribution of a certain parameter, e.g. soil carbon, and we would say the soil carbon in your district looks like this; this is benchmarking. With this we would be able to say where a land manager sits in relation to others in your district with similar land use type. One of the points of doing that is to get away from saying you are good or bad and to allow somebody to see if they are at the top end or at the bottom end or in the middle of that distribution of similar land, activities and soils. This then starts a thought process, or a conversation, with the land manager as to whether action needs to be taken. It gives that contextual information for them to compare and contrast with other farms or land types in the area.
Ultimately what we’d like to be able to do is to predict changes to soil health after changes to management or land use. If a land manager wants to change the land use type or change the management practices then they would be able to predict how the soil might respond. So, for example, what will the change do to your soil carbon, what’s that going to do to your pH, and so on and decide if you want to make that change.
Q: Can you explain how the soil will be mapped into a digital twin and then and how this can be used to project and model future scenarios?
David Robinson
So the point of a digital twin is really a digital description of the landscape. The digital twin is a digital mirror of what’s happening in the landscape. And it’s our best estimate to have a representation in the digital world of what that landscape is like, what the properties are. This can be used to see the system operating in real time.
The ultimate goal of the digital twin is that a stakeholder, a farmer, or potentially a forester, can interact with the information that they’re given and be able to make projections into the future. So if they adjust their management, they can see the implications of that. For instance, if a farmer decides they’re going to take this area of arable land and plant trees because of an incentive we could predict what would happen to the soil health. By ‘planting’ those trees in the digital twin you would know what will happen in 10, 20, 30 years’ time. The digital twin will tell us how that would affect the soil properties, soil carbon, soil pH, and so on.
At the big scale at which we’re operating, that will hopefully help with strategy and planning on a macro-scale. The project is generally pitched at a regional to pan-European scale where policy makers would be using the information. We are less focused on what happens in an individual field. And although, for instance, the app will give you some information, it’s really about interpreting what happens at those bigger scales and how changes to policy will have an effect.
So a policy maker might ask “where in Europe is soil carbon going up and where is it going down and where would the best place to intervene be in a particular way to increase soil carbon across Europe”. And then they would develop their policy based on the understanding from the analysis we have been able to provide. We help them to project the implications of implementing a particular policy on soils in a particular area.
Q: How will end users like policy makers and farmers benefit from this project?
David Robinson
We have very little information on agricultural policy decisions will mean for soils and what implications there are for what functions we get from the soils, whether that’s food production, climate mitigation or hydrological aspects of the environment. We really need to understand some of those implications and the different trade-offs that we’re having to make. For example, if we’re looking at above ground, we can understand that if we go and cut a forest down and we create an arable cropland environment, we know that that’s going to have certain implications for the biodiversity of the area; we can see it. We can’t easily see what’s happening to the soil, despite some big changes often occurring.
We spend an awful lot of money on things like the common agricultural policy, doing interventions, but we need to better understand what functionality this delivers, this requires monitoring and its interpretation. Our work in AI4SoilHealth will help people understand what they are actually delivering and if they are delivering the right things.
And there’s a strategic element as well. We’ve already seen with conflicts around the world how that can affect food production. If we can use this analysis to build our food production systems more sustainability, with more carbon, more nutrients banked into the soils. Then we will be more prepared to weather future economic or environmental shocks. After all, history has shown us the very rise and fall of civilisation has depended on the ability of societies to manage soils.
