Sebastian Gutierrez and Lucas Gomes from the Department of Agroecology write about their research into new tools for national soil health monitoring.
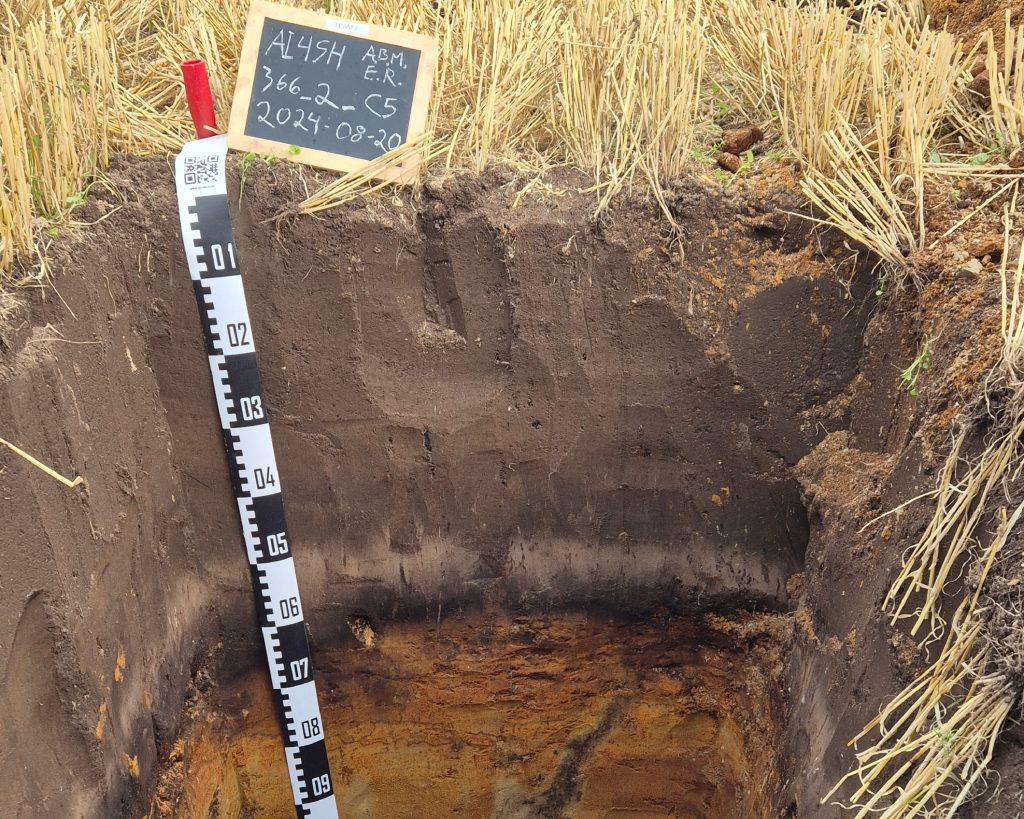
The European Union is working to approve the Soil Monitoring Law, which aims to achieve healthy soils by 2050. However, major challenges remain regarding the methods used to monitor and assess soil health across a continent with such diverse landscapes. As part of the AI4SoilHealth project, a recent study from Aarhus University presents a practical and scalable solution for agricultural soils, using an extensive soil sample dataset and soil maps from Denmark. This framework proposes creating specific Soil Monitoring Units (SMUs). These are like designated areas we’ll use to set starting points or goals for soil health, based on information we already have.
These SMUs aim to establish homogenous areas based on landscape characteristics that are not expected to change in the short term. For example, the spatial reference for soil sampling, monitoring, and future soil health assessment during periodic monitoring cycles as outlined in the Soil Monitoring Law. Each SMU represents a unique combination of soil texture, landform, and wetland type, and was further stratified according to cropping systems.
Traditional approaches to assessing soil health often rely on universal thresholds that fail to reflect local differences in climate, land use, and soil type. This study challenges that approach by proposing site-specific benchmarks. These new adapted ranges of soil health indicators would be based on local soil-forming conditions and cropping systems. We used over 25,000 soil data points to calculate thresholds for each SMU. These benchmarks gave us a more accurate picture of what “typical” or “atypical” soil looks like in each area, serving as a critical baseline for detecting degradation and guiding land management.
What we consider as soil health indicators
We used field data and model-informed indicators, selected to align with both scientific best practices and EU policy targets. These included:
- Soil Organic Carbon (SOC) – a key metric for soil fertility.
- Bulk Density (BD) – which affects water movement and root growth.
- Soil pH – crucial for nutrient availability.
- Clay-to-SOC Ratio – reflecting soil organic matter protection and relevant for carbon storage in soil.
- Electrical Conductivity (EC) – a proxy for soil salinity.
- Nitrogen Leaching – indicates nitrogen losses and pollution risk.
- Water Erosion – indicates landscape-level soil redistribution induced by water.
Benchmarks for each indicator were calculated using the middle 80% of values (10th–90th percentile) within each SMU. Any soil values falling outside these ranges were flagged as “above” or “below typical”.
What we found: A map of potential threats
One of the most important outcomes of this study was a national map for Danish agricultural land with different SMUs, highlighting regions facing multiple threats at the same time. We obtained that:
- Although the SMUs in southern Zealand are mostly flat areas with clay-rich soils (conditions that would typically favor high organic carbon storage), they showed low carbon content.
- In northern Jutland, some areas showed low OC content. This is likely due to the sandy soils, which limit OC accumulation and make it easier for nutrients to be leached away by water.
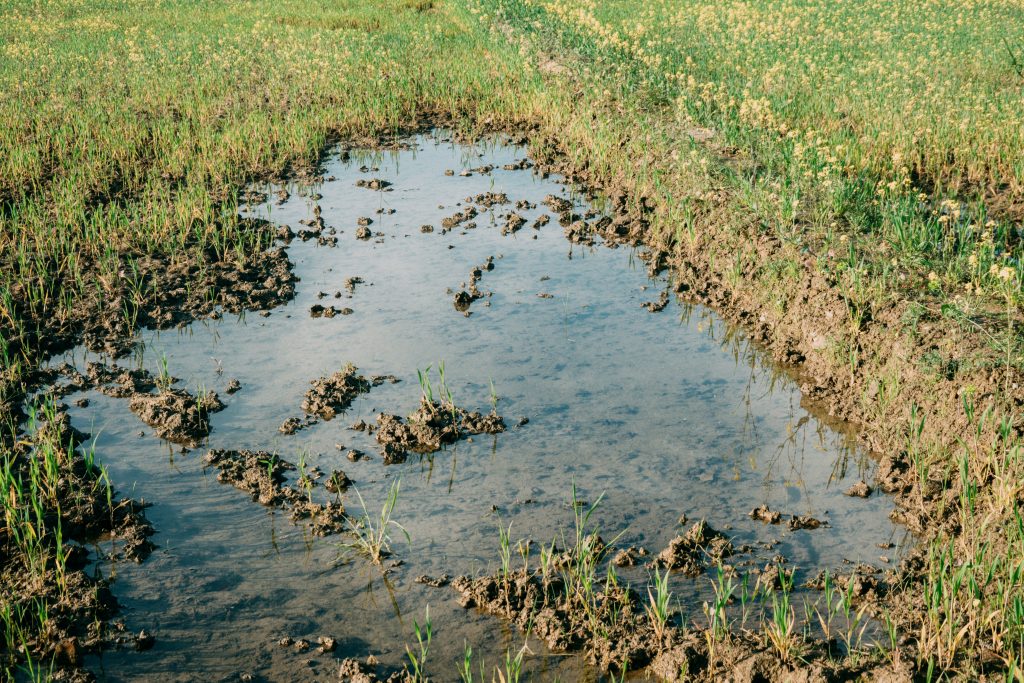
- Wetland areas that have been heavily drained for agriculture often showed high bulk density and a greater risk of water erosion, both of which may reduce the soil’s ability to accumulate OC.
This information might be actionable and not just a diagnosis. By identifying where and how soils deviate from expected ranges, policymakers, land managers, and farmers can prioritize areas for restoration, target subsidies, or adjust practices to mitigate risks.
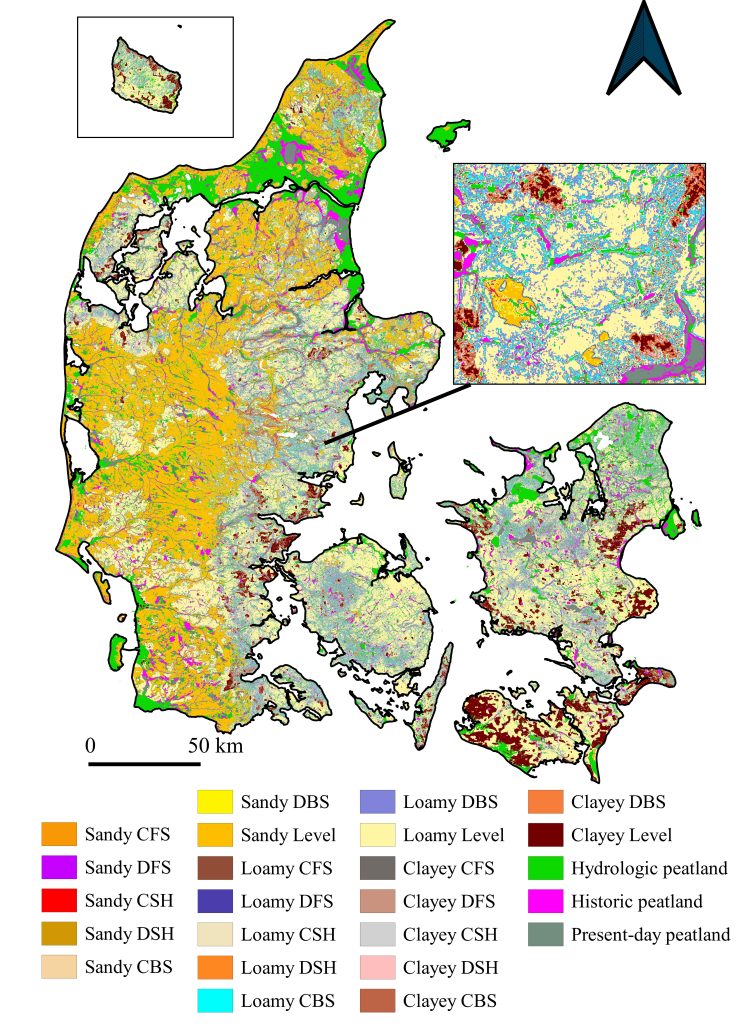
Soil monitoring units for Danish soils. Strata based on soil textural classes, landforms, and wetland types. The categories of landform element classification are convergent footslope (CFS), divergent footslope (DFS), convergent shoulder (CSH), divergent shoulder (DSH), convergent backslope (CBS), divergent backslope (DBS), and level or flat area.
What does this mean for Europe?
This benchmarking framework is data-driven and adaptable, as other countries can replicate it using their environmental datasets. Importantly, the framework aligns closely with the proposed EU Soil Monitoring and Resilience Law, making it a tool for national compliance and planning.
While the study focused on topsoil and did not include biological indicators like microbial activity, we acknowledge these as future areas for expansion. As soil data collection continues to improve, this benchmark-driven approach can evolve to include more variables and deeper soil layers.
In a time of escalating climate pressure and biodiversity loss, soil may be our most undervalued ally. This Danish study offers not only a scientific roadmap but also a practical scheme for how we can track soil health at diverse scales.
