With soil health rising up the EU policy agenda, new science is helping explain where degradation risks are growing. Dr Mehdi Afshar’s recent work provides a timely, continent‑wide assessment. In this blog, Mehdi shares his policy maker digest of a recent paper he published in Nature entitled: Spatial and temporal assessment of soil degradation risk in Europe.
Factors to consider when mapping soil degradation across a continent
European soils are affected by multiple “threats” at the same time including erosion, loss of soil organic carbon (SOC), salinization, and harmful shifts in soil pH, among others. The scientific challenge is that we often study these threats separately, using different datasets, different methods, and different thresholds. That makes it hard to answer basic continent-scale questions like:
- Where is soil degradation risk highest right now?
- Is it getting better or worse over time?
- What factors (climate, land cover, terrain, parent material) are most strongly linked to changes?
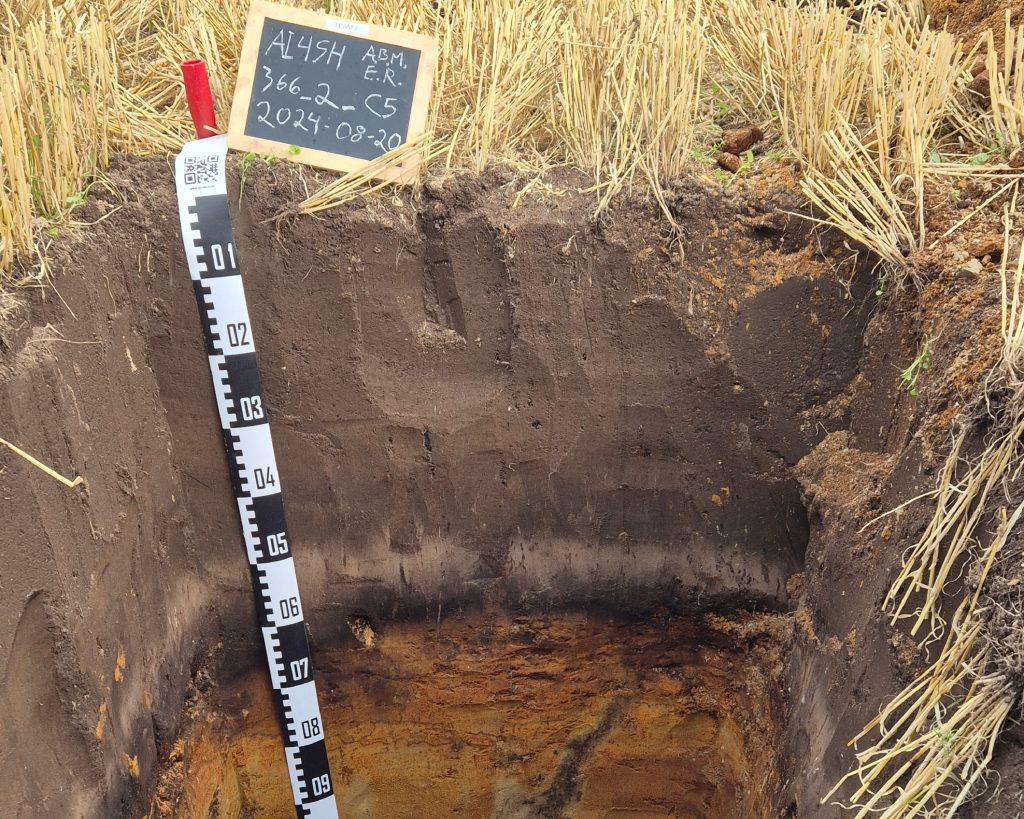
A second scientific challenge is that high-quality soil measurements (like those from the EU’s LUCAS soil survey) are point samples taken in particular years. They are excellent for consistency across borders, but they are not continuous in space or time. So, large areas between sampling points and most years between campaigns remain unobserved.
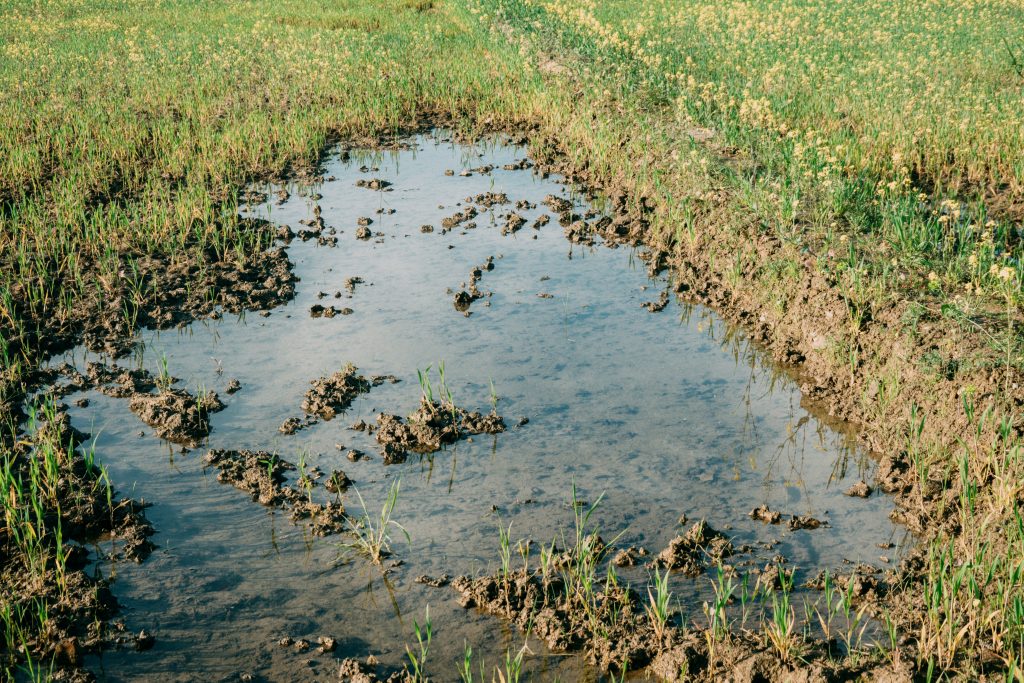
Why mapping soil degradation is important for farmers
From a land manager’s perspective, the problem is practical and urgent. Soil degradation reduces productivity and resilience (especially under climate stress), but interventions cost time and money. Hence, decision makers need:
- Hotspot maps (where the risk is highest)
- Trend maps (where risk is rising)
- Driver insights (what is likely causing the risk locally)
- Information at a usable resolution for prioritizing actions (e.g., focusing on vulnerable rainfed cropland regions)
Our paper targets the gap of a harmonized, Europe-wide, multi-indicator, time-resolved assessment that is usable for planning and policy.
How does creating a Soil Degradation Proxy (SDP) help solve this problem?
The Soil Degradation Proxy (SDP) is the core innovation of our study. The SDP provides a continuous, unitless score ranging from 0 to 1 that captures soil degradation risk along a spectrum.
Existing continental products rely on thresholds (e.g., “SOC below X” or “erosion rate above Y”), which turns degradation risk into a binary classification. However, soils can be slightly, moderately, or severely at risk, and small changes matter if we want early warnings.
SDP integrates four indicators that represent different degradation domains:
- Erosion rate (physical degradation)
- Electrical conductivity (EC) (salinity risk; chemical degradation)
- Soil pH (acidity/alkalinity stress; bio-chemical implications)
- Soil organic carbon (SOC) (bio-chemical/structural resilience indicator)
Each indicator is rescaled using its distribution (CDF-based scaling), and then combined with equal weighting to produce a single proxy score. SDP is designed in a way that higher values of it mean higher degradation risk (e.g., high erosion and EC increase SDP; higher SOC decreases SDP; pH becomes worse as it moves away from an “optimum” around 6.5).
The SDP helps in solving challenges and problems outlined aboveby combining multiple soil threats into a single, continuous measure of degradation risk that can be compared consistently across Europe. By moving beyond binary “degraded / not degraded” classifications, the SDP captures gradual changes in soil condition and enables early detection of emerging risks. When coupled with machine learning, it allows sparse soil observations from LUCAS to be translated into continuous maps and trends, filling gaps in space and time and providing policymakers and land managers with clear hotspot, trend, and prioritization information.
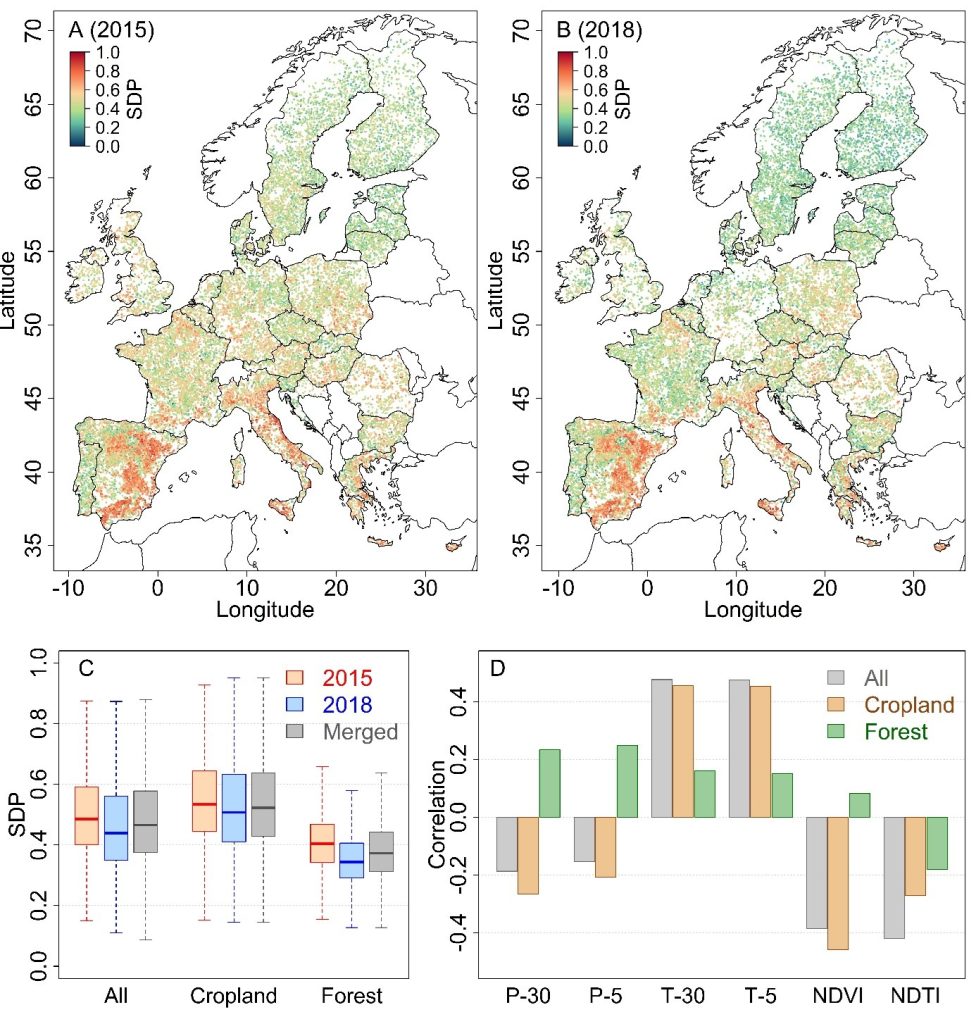
Figure 1: Spatial and statistical variations of SDP across LUCAS observations for the year 2015 and 2018. A&B, Spatial distribution of SDP across LUCAS observations for years 2015 and 2018, respectively. C, Variation of SDP across different land covers and soil textures. D, Correlation of SDP with different environmental variables. P-30: Long-term average of annual precipitation (last 30 years), P-5: Short-term average of annual precipitation (last 5 years), T-30: Long-term average of temperature (last 30 years), T-5: Short-term average of temperature (last 5 years), NDVI: Average NDVI between months May to August, NDTI: Average NDTI between months March to April.
How does machine learning help us map soils, and why is it useful for future monitoring?
We use Random Forest (RF) machine learning to learn relationships between observed SDP at LUCAS soil points (from 2015 and 2018 sampling), and a large set of environmental predictors available wall-to-wall across Europe annually.
RF is essentially an “ensemble of decision trees.” Each tree learns a set of if-then rules (e.g., “if land cover is cropland AND vegetation healthy condition is high AND precipitation is not low, SDP tends to be higher”). Many trees are trained, each seeing slightly different subsets of the data, and their results are averaged to reach to the final prediction values.
This approach is powerful for future soil health monitoring as it can translate limited field sampling into continuous maps, update annually as new climate/remote sensing layers become available, and provide both risk levels and drivers.
How does this move us closer to a “real-time” warning system for soil health across Europe?
Our study delivers a practical stepping-stone toward near-real-time warning by learning from LUCAS observations and applying the model to yearly environmental layers, performing pixel-wise trend analysis (2000-2022) and flagging statistically significant increases in SDP, and providing a framework that can refresh the analysis as data streams are refreshed.
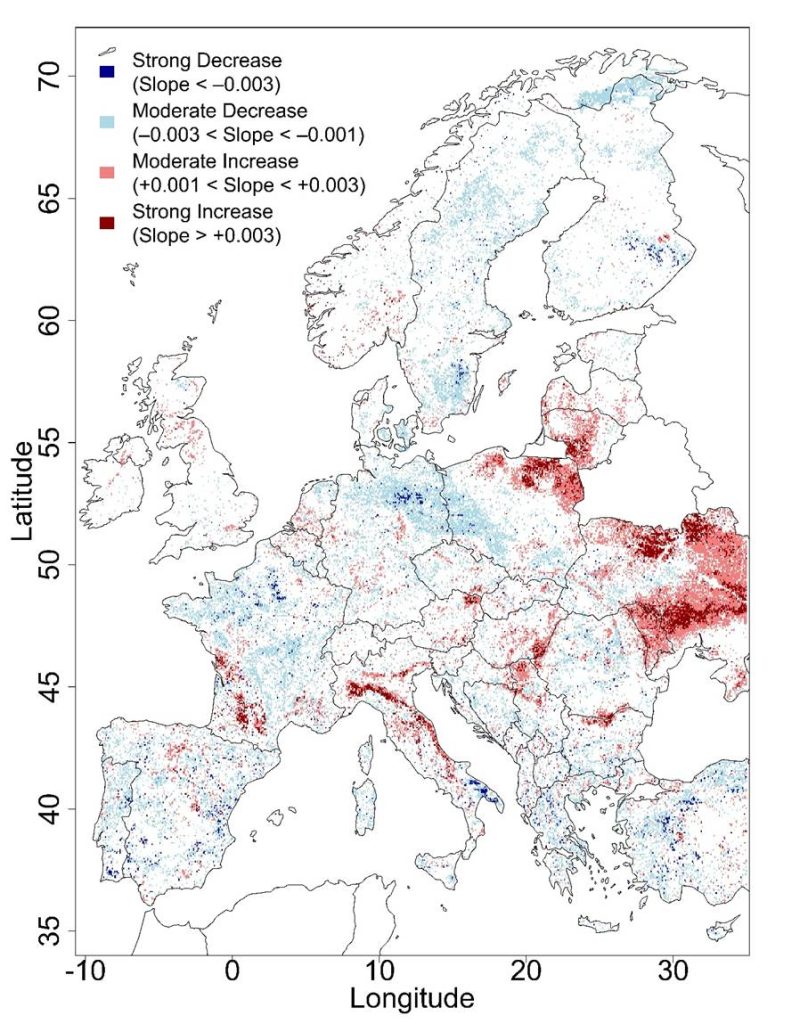
Figure 2: Trends of SDP across Europe between 2000 and 2022. The non-significant slopes (p > 0.01) are not shown. Positive slope shows an increase in SDP (going toward higher degradation risk and unhealthier soil), and negative slope means a decrease in SDP (going toward lower degradation risk and healthier soil).
Key conclusions for policy makers and soil managers
Our most actionable takeaways are:
- Highest degradation risk is concentrated in southern Europe, especially in intensively managed or sparsely vegetated landscapes. This supports prioritizing Mediterranean and semi-arid systems for targeted investment and soil degradation risk reduction.
- Degradation risk has been increasing in parts of Europe over the last two decades. Our study estimates that about 7.1–7.2% of Europe’s land surface shows increasing SDP trends, with notable increases in parts of Eastern Europe.
- Rainfed croplands are the most affected land cover type in the trend analysis. Hence, rainfed systems may need priority support for soil cover, residue management, erosion control, and carbon-building practices.
- Land cover is the single most influential driver in the model, and it modulates how climate affects degradation risk. This matters for policy as land management choices can amplify or reduce climate pressures.
- Vegetation cover and residues matter: higher NDVI (more active vegetation) and higher NDTI (more residues / less bare disturbance) are associated with lower SDP in croplands, aligning strongly with practical conservation agriculture logic.
How does the research fit into AI4SoilHealth and the EU Soil Monitoring Law?
One of the main objectives of AI4SoilHealth is to identify and operationalize robust soil health proxies that can detect both the state of soils and changes over time in a harmonized way across Europe. The SDP supports this goal by integrating multiple degradation-related indicators into a single continuous metric that acts as a cost-effective and scalable proxy for quantifying soil degradation risk.
AI4SoilHealth aims to build a Soil Digital Twin for Europe, a digital representation of soil systems that combines field observations, Earth observation data, and AI models to monitor and simulate soil processes over space and time. Our study demonstrates a key component of this vision in practice. By using machine learning to link LUCAS soil observations with annually updated environmental and satellite-derived data, the research shows how soil degradation risk can be mapped consistently across Europe and tracked over multiple decades.
Another core ambition of AI4SoilHealth is to move beyond static soil maps towards continuous monitoring and change detection, including the identification of degrading or improving trends. The SDP trend analysis (2000-2022) directly contributes to this ambition by highlighting where soil degradation risk is increasing, particularly in rainfed croplands and parts of southern and eastern Europe.
Relevance for the EU Soil Monitoring Law
The new EU Soil Monitoring Law requires Member States to assess soil health in a consistent, comparable, and repeatable way, while supporting early identification of risks and prioritization of management responses. This research supports those requirements by using harmonized EU-wide data (LUCAS soil, Copernicus-based products) and supporting comparability across borders, addressing multiple soil threats simultaneously, producing continuous risk scores and trends, and providing spatially explicit outputs that can help Member States target monitoring efforts and interventions.
Dr Mehdi Afshar is a research associate for the Institute of Geo-Hydroinformatics, Hamburg University of Technology, Hamburg, Germany.
His paper: Afshar, M. H., Hassani, A., Aminzadeh, M., Borrelli, P., Panagos, P., Robinson, D. A., Or. Dani., Shokri, N. Spatial and temporal assessment of soil degradation risk in Europe. Sci Rep 15, 44636 (2025). https://doi.org/10.1038/s41598-025-33318-7